this post was submitted on 30 Dec 2024
1308 points (98.7% liked)
Microblog Memes
7420 readers
3100 users here now
A place to share screenshots of Microblog posts, whether from Mastodon, tumblr, ~~Twitter~~ X, KBin, Threads or elsewhere.
Created as an evolution of White People Twitter and other tweet-capture subreddits.
Rules:
- Please put at least one word relevant to the post in the post title.
- Be nice.
- No advertising, brand promotion or guerilla marketing.
- Posters are encouraged to link to the toot or tweet etc in the description of posts.
Related communities:
founded 2 years ago
MODERATORS
you are viewing a single comment's thread
view the rest of the comments
view the rest of the comments

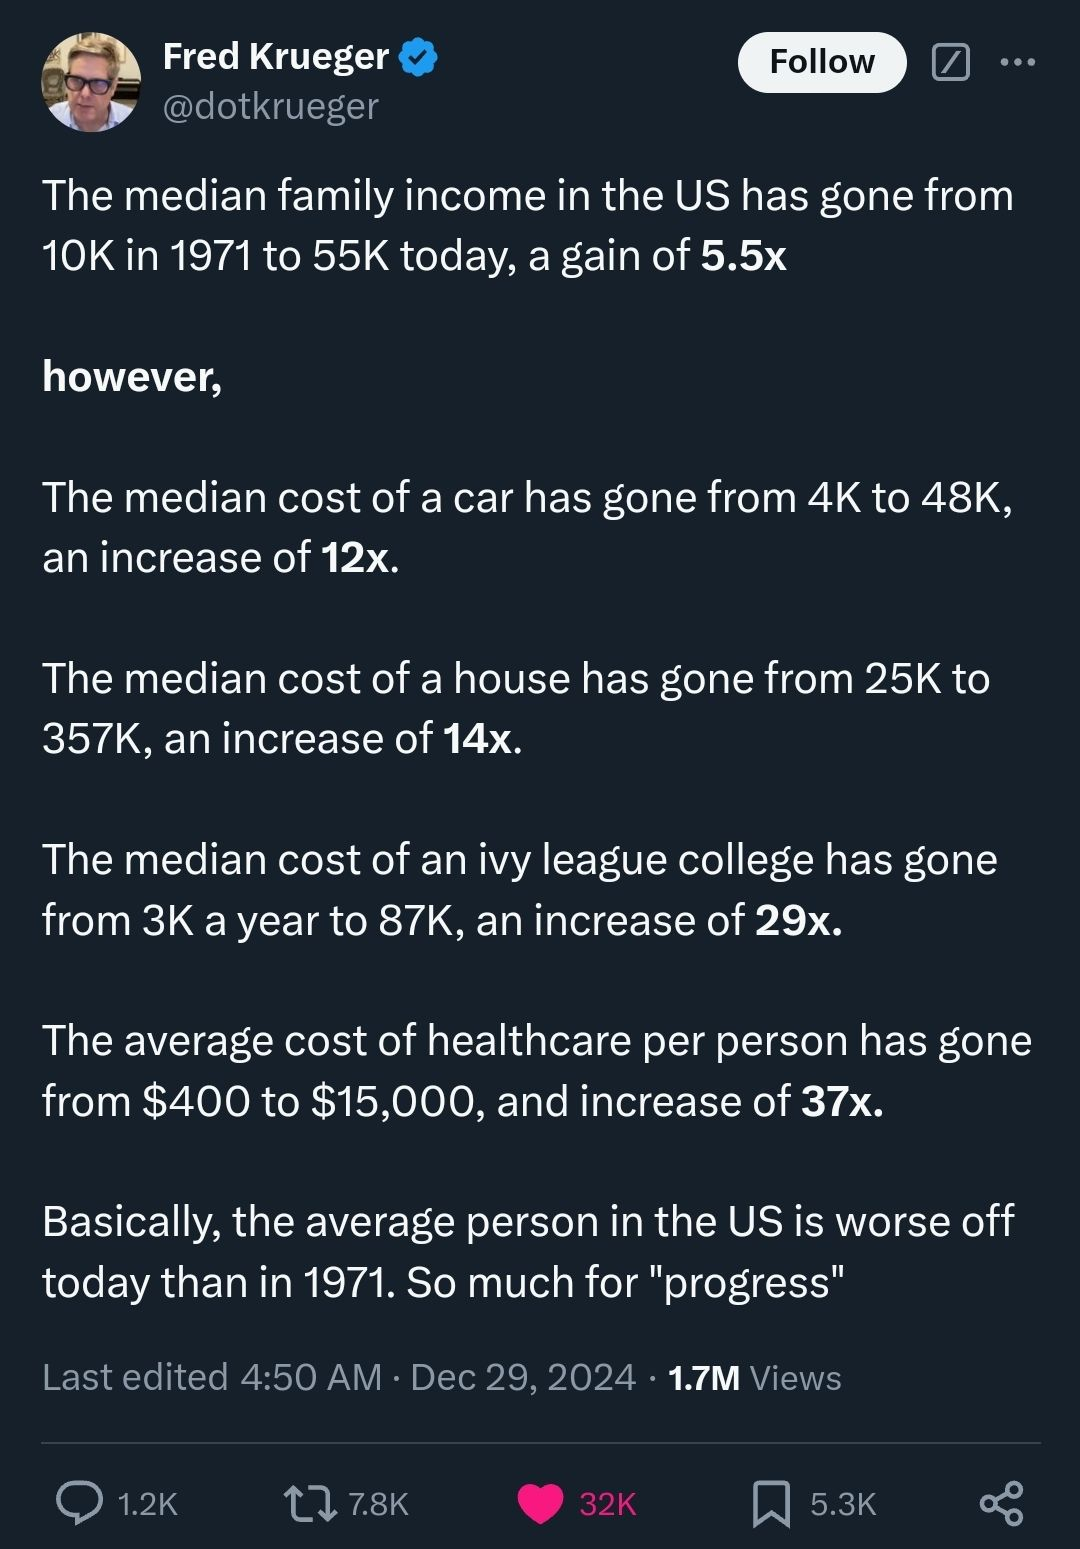
When talking about stuff like this, large diverse populations and a near continuous variables, a single measure of central tendency is not very informative whichever you choose. They necessarily misrepresent most of the population, quite a lot, just for the sake of what . . . brevity?
That seems lazy to me and makes me think the author doesn't really care too much about the people they're trying to describe.
At least pick a few points across the distribution, and a give a bit more time to understand or explain maybe like 5 or 6 "representatives" out of of however many millions are being summarised by the one statistic.
If the author can't afford to draw a full fledged histogram - at least do a box-and-whiskers.
Maybe that twitter thing is just fucking awful.
Kind of feel like the box and whisker would look something like this, only worse.
Median is (arguably) best if you want to give one value. Of course it's better to give more, like first quartile, median, third quartile. But sometimes brevity is useful too