1
Be respectful
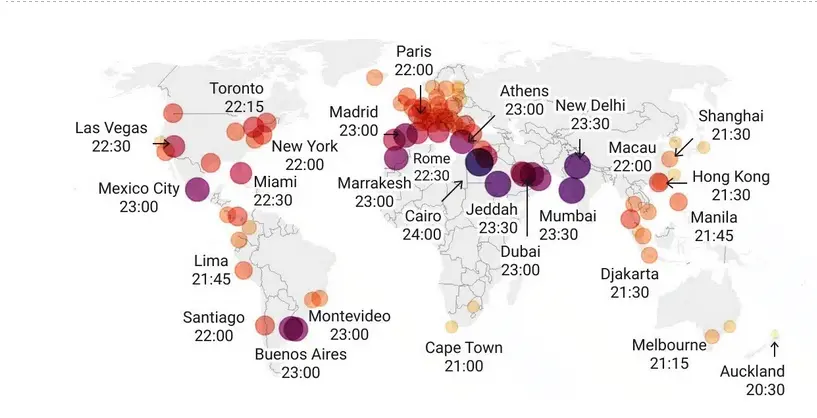
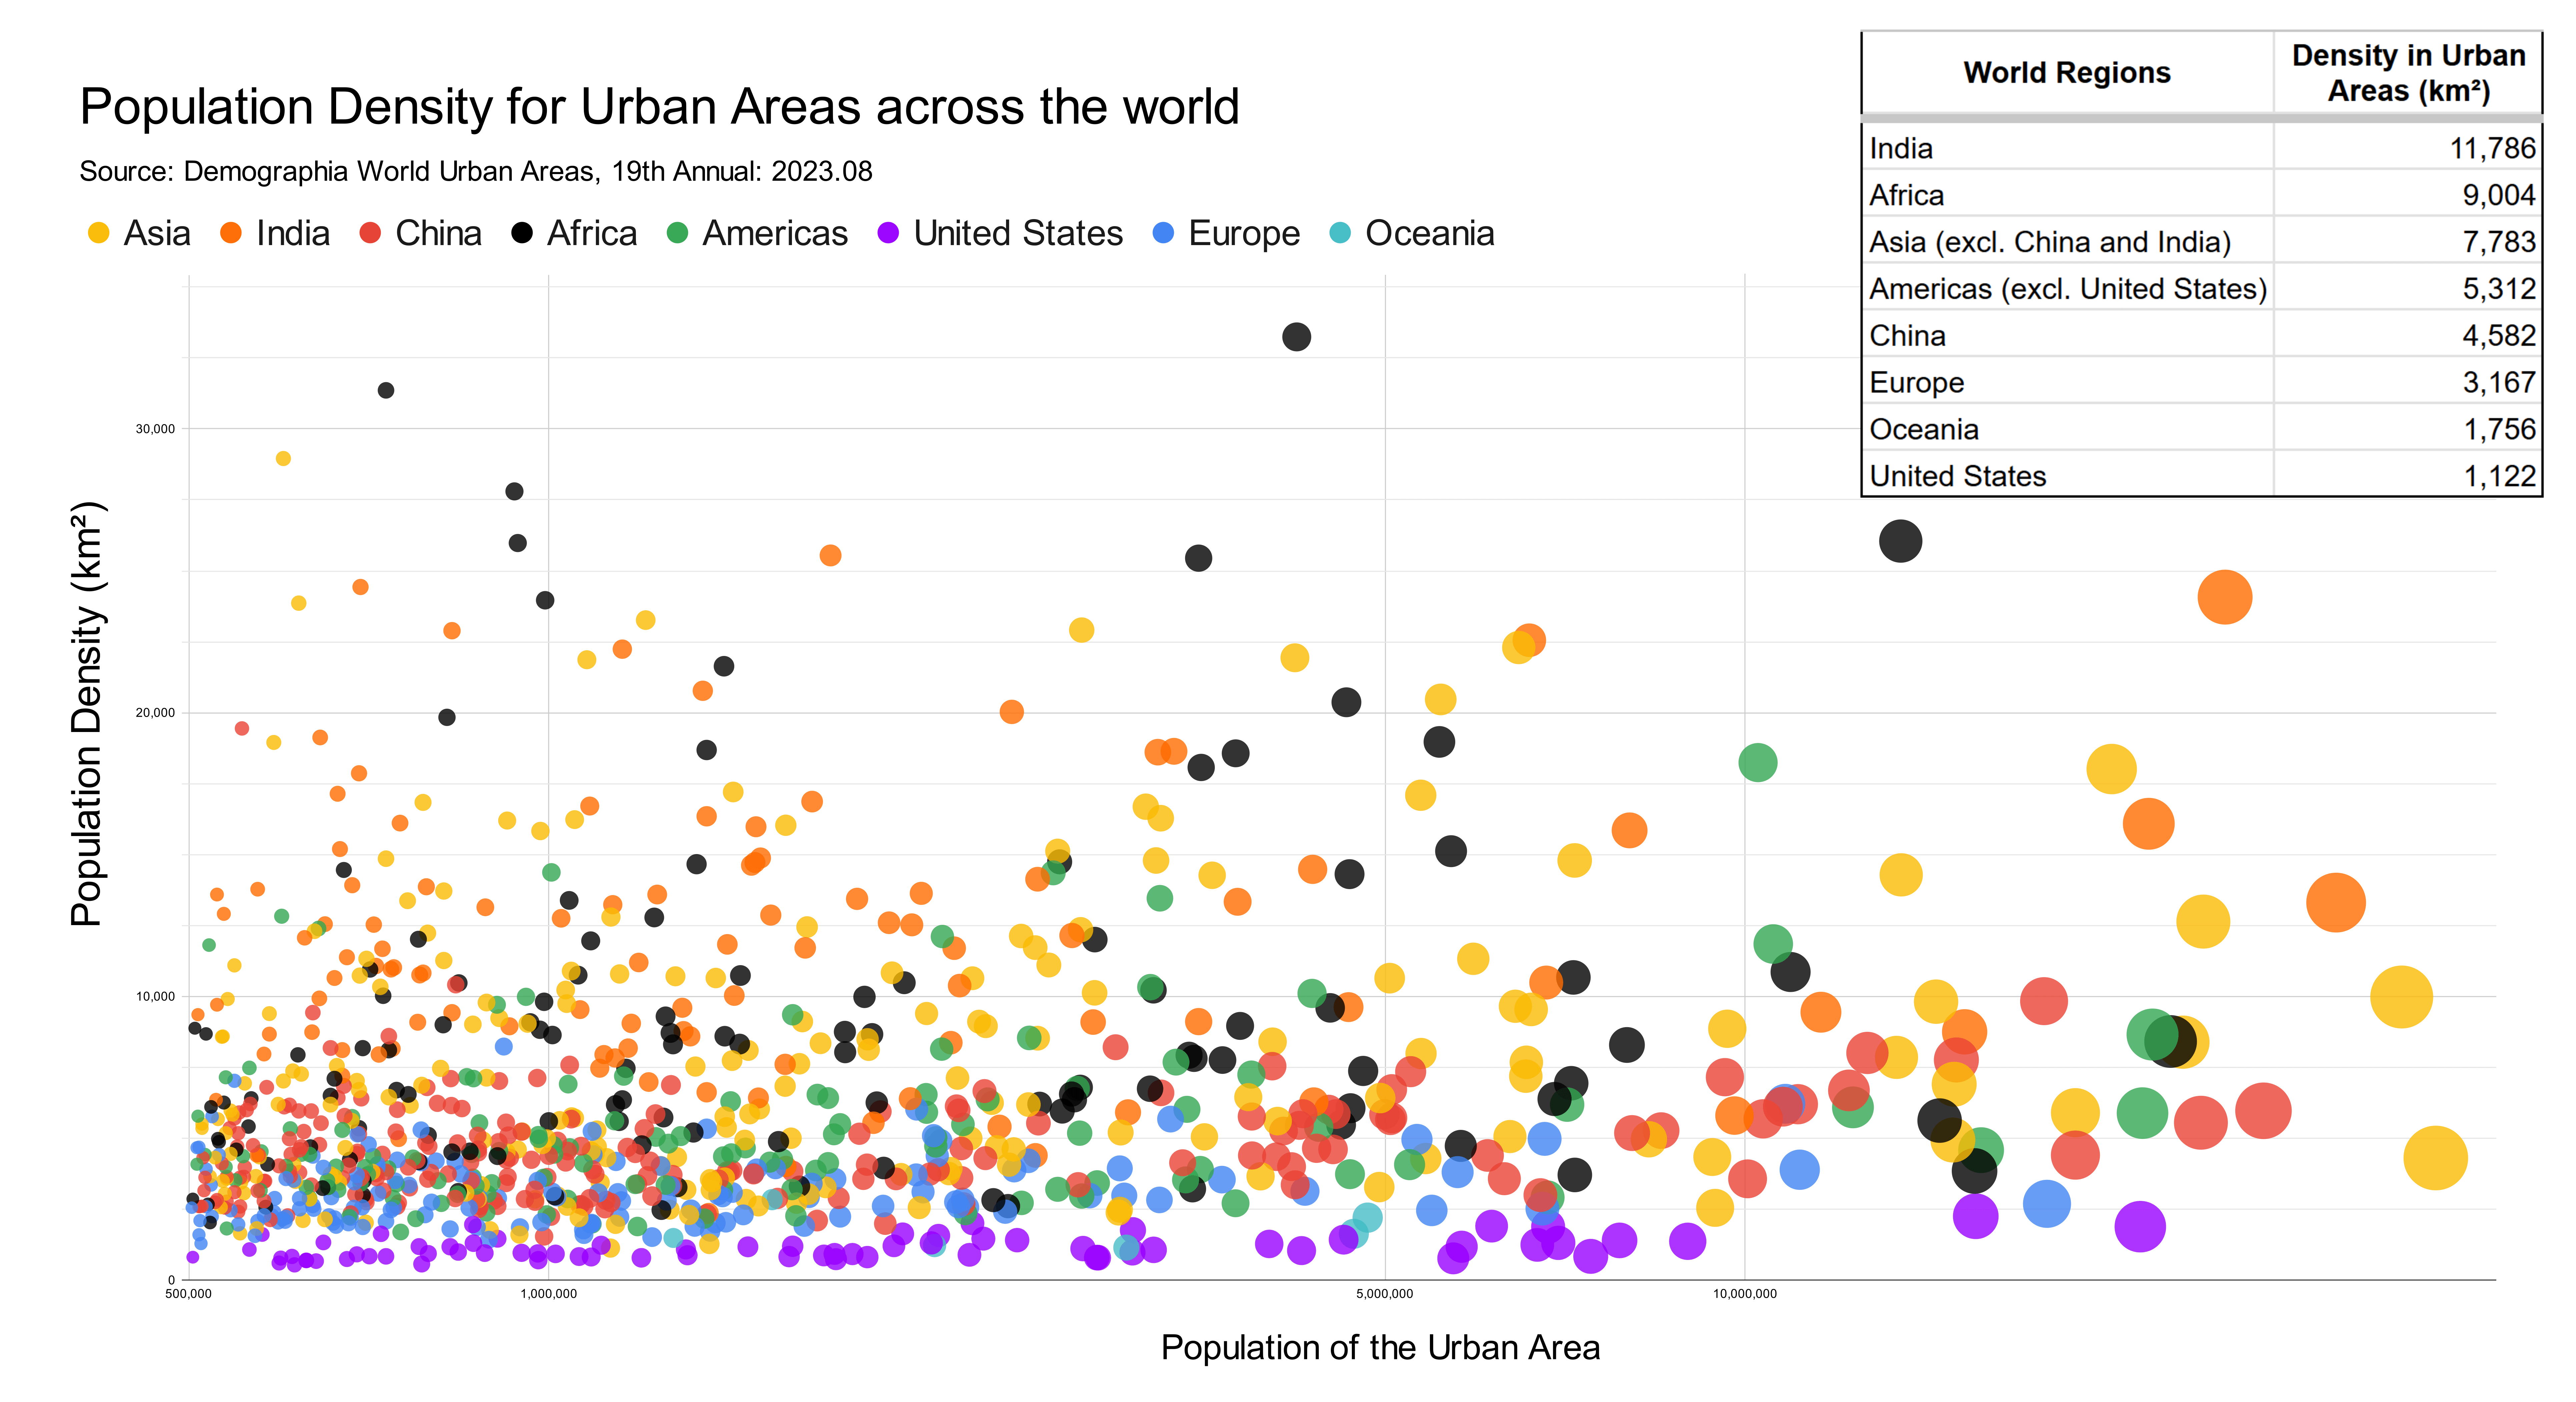
My chart shows population density in all urban areas that have over half a million people. "Urban area" basically means the built up area in and around a city, including its suburbs. The chart would be way too busy if it included labels for each city, so instead I opted to group them by the part of the world they are located in. This shows the striking difference in urban density across different parts of the world.
My data source for both population and population density came from Demographia World Urban Areas, 19th Annual: 2023.08_. This is a regularly updated collection of statistics for urban areas that include population and land area. I made this chart using Google Sheets and edited it with Inkscape.
If you're interested in diving deeper into this data, I put together a spreadsheet of the data and a detailed version of the map with city labels (which is still very cluttered). Enjoy!
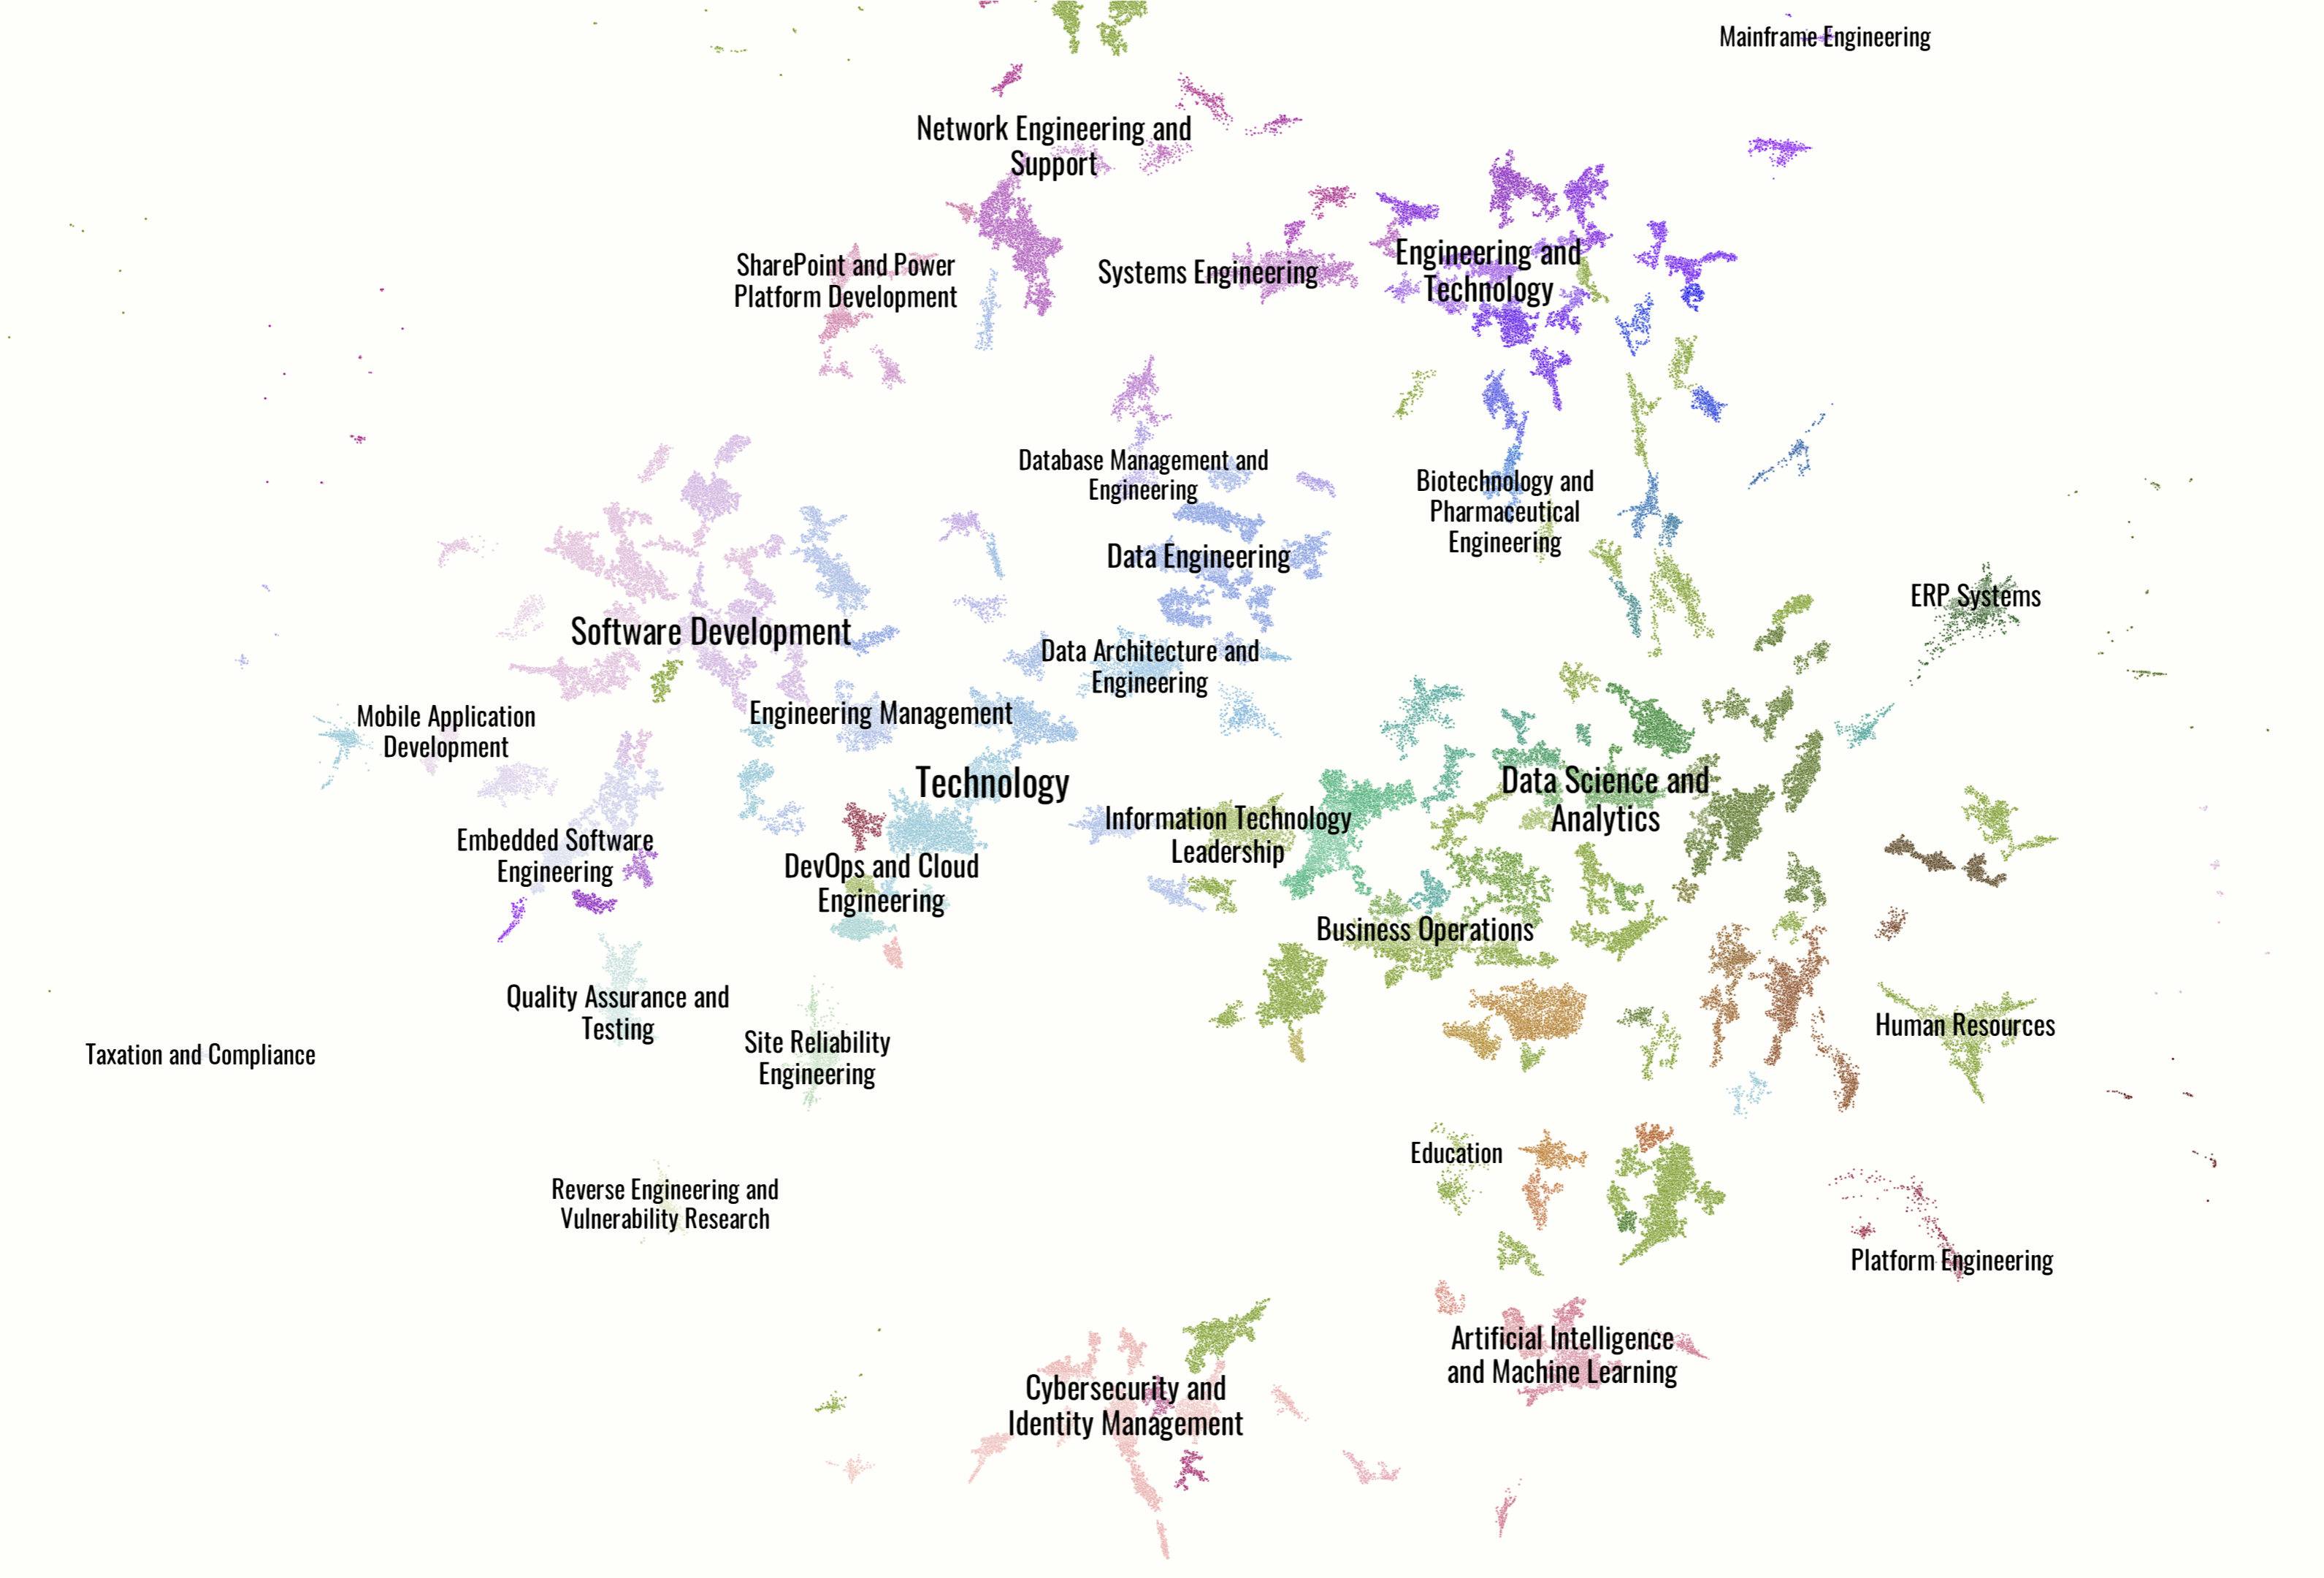
Collected US 2024 tech job postings from Indeed and embedded them with Open AI text embedding large. Reduced dimensionality and clustered via UMAP and HDBSCAN. Topic modeled with Open AI chat API. Visualized with DataMapPlot. Github pages https://hazondata.github.io/ has full interactive map. I also have real-time insights into tech job postings on my site hazon.fyi
"Live link: https://perthirtysix.com/tool/birthday-paradox
I built a sandbox that lets you simulate and understand the birthday paradox and few related problems. The birthday paradox tells us that in a room of 23 people, there are 50/50 odds that 2 people will have the same birthday (assuming a non-leap year and that birthdays are totally random, which they aren’t exactly).
I’ve always found these types of problems really interesting and counterintuitive. The “aha” moment for me was realizing that any two people sharing a birthday satisfies the problem, and at 23 people there are 253 different combinations of pairs between them.
I hope you enjoy messing around with the tool!
Built using Vue and p5.js, with probability formulas adapted from Wikipedia."
"I created this visualization to track Shohei Ohtani’s pursuit of a 50-50 season—achieving 50 home runs and 50 stolen bases in a single MLB season. Using data from ESPN, I simulated the remainder of his season to estimate the probabilities of reaching the "clubs": 30-30, 40-40, and 50-50.
The 50-50 club refers to a player hitting 50 home runs and stealing 50 bases in a single season, which has never been accomplished in MLB history. It requires a rare combination of power and speed: the 40-40 club (40 HR, 40 SB) had been joined by only five players before this year.
I built a simulation model to project Ohtani’s performance over the remaining games of the season. The model uses his current stats as a baseline and generates a range of possible outcomes based on typical variability in player performance. To stabilize the projection at the beginning of the season, I used a Bayesian prior based on his historical stats. As the season goes on, the prior is given less weight so that the current season's rates start to take over.
Data Source: ESPN
Tools Used: Pandas, NumPy, Matplotlib"
cross-posted from: https://sh.itjust.works/post/24428192
Stolen from Reddit.
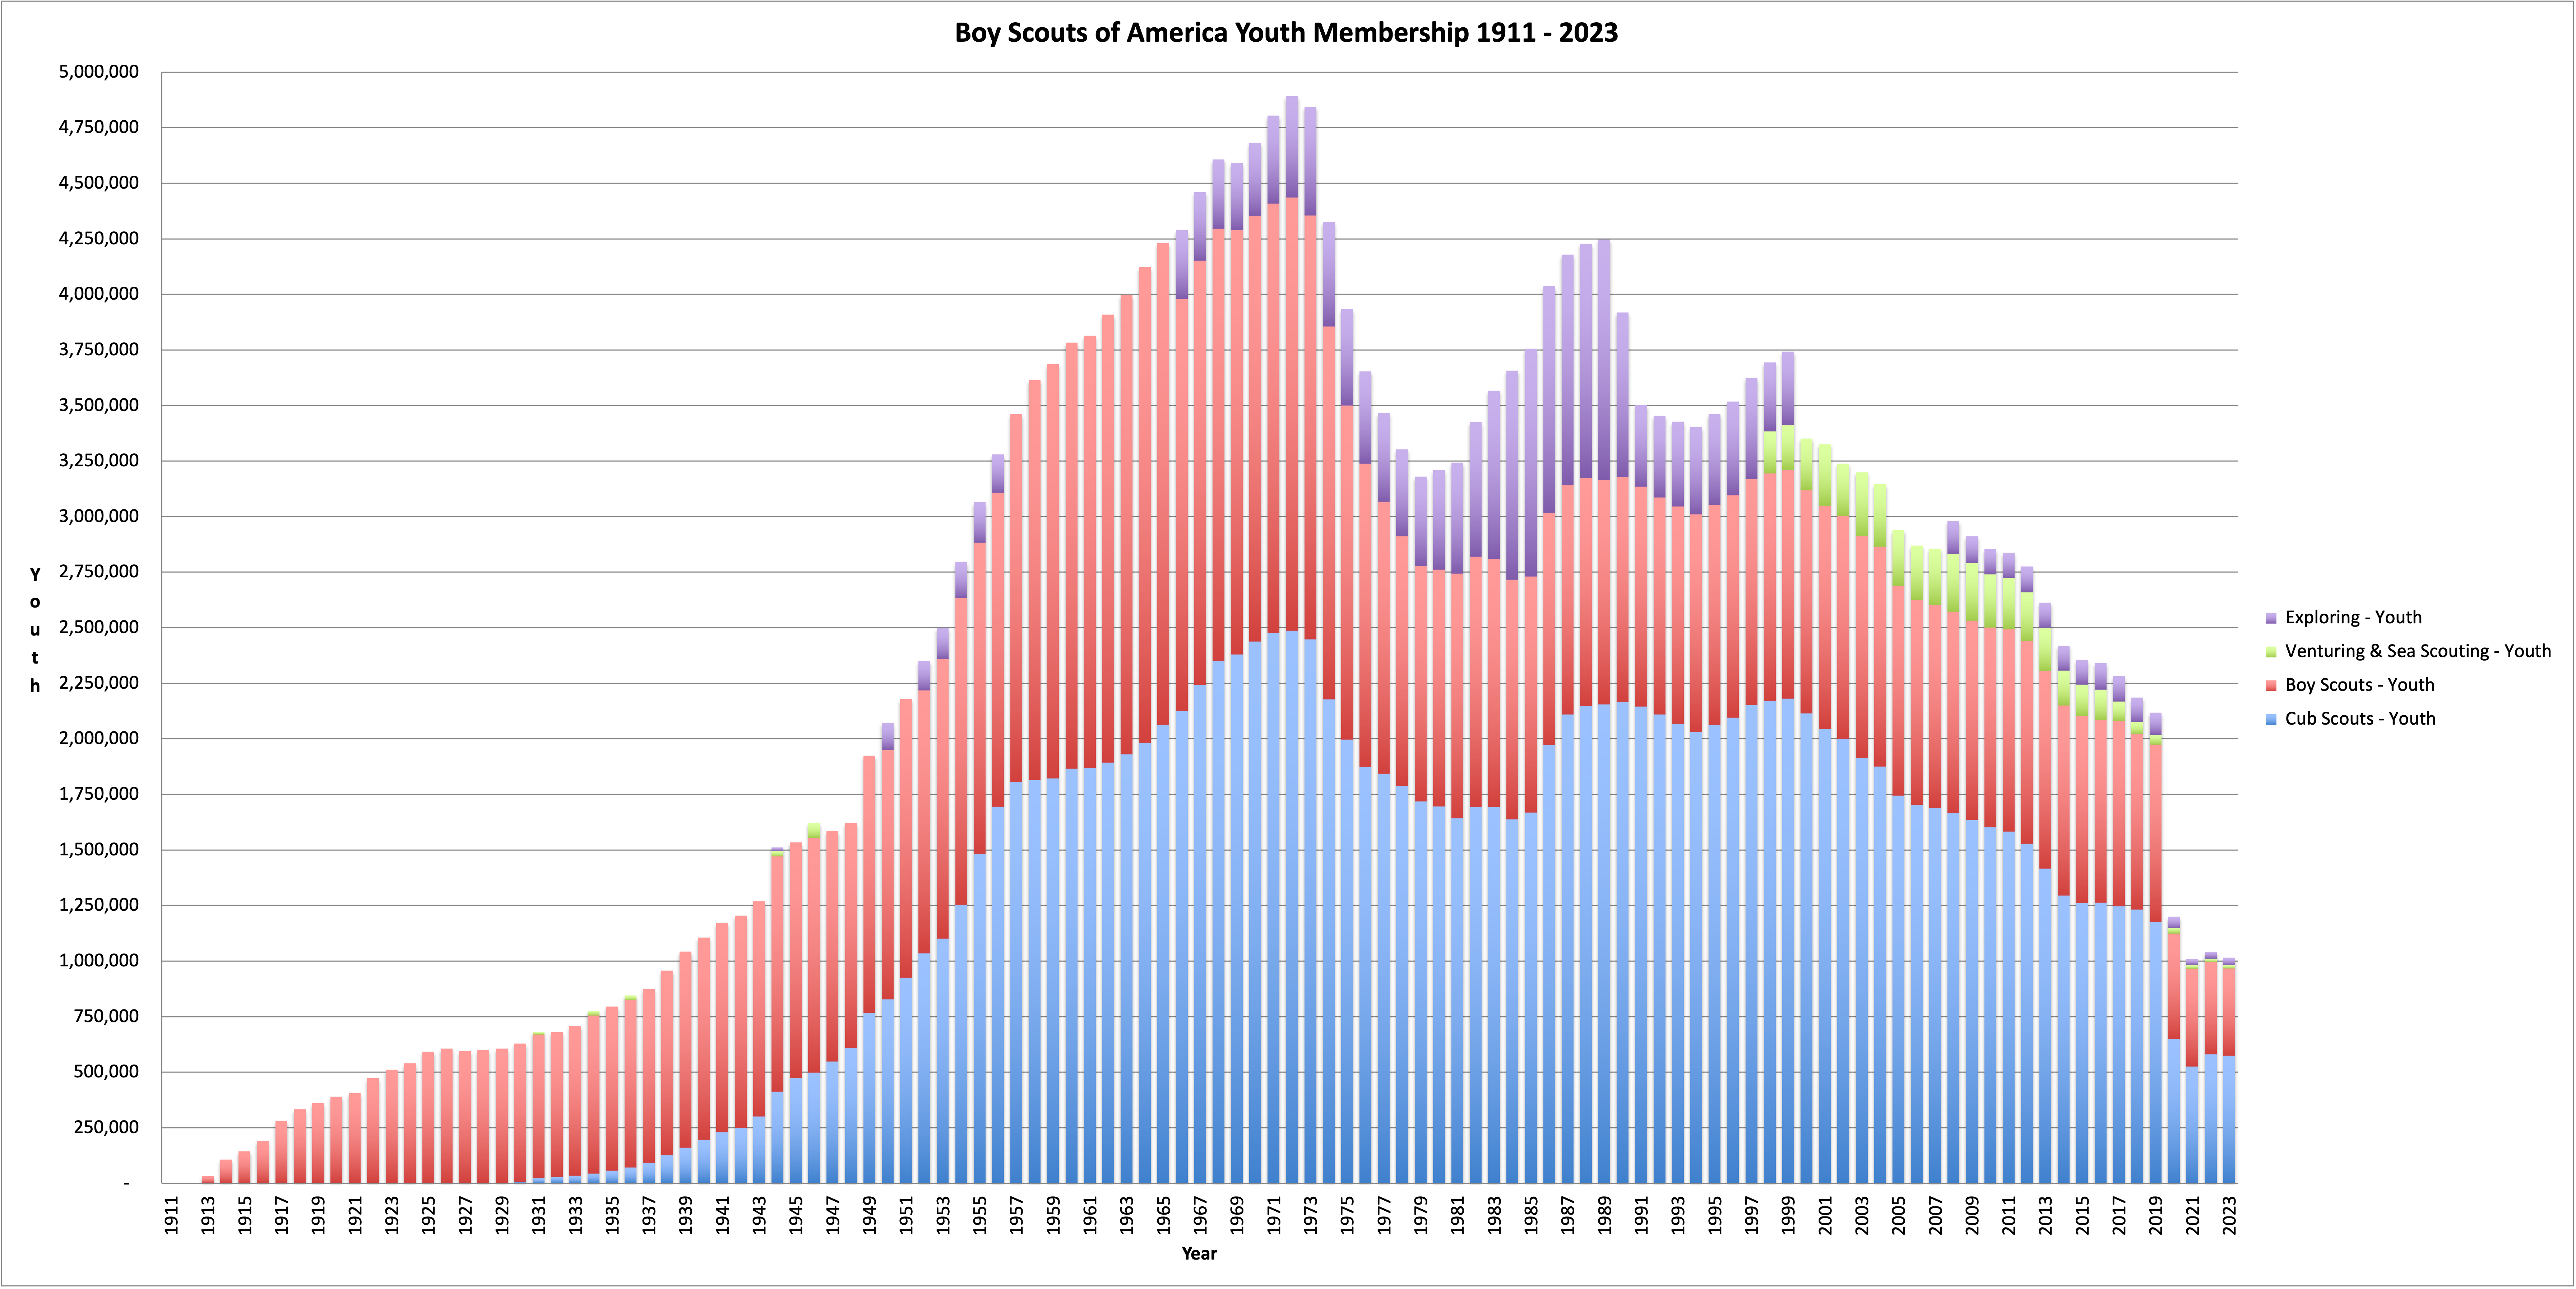
The big drop in the 1970's was supposedly due to a change in the program to de-emphasize outdoor activities. The step down in 2019 was the LDS church cutting ties and starting their own program.
If you consider this as a proportion of the population it's an even bigger drop. In 1970 there were about 4.8M scouts in a population of 205M, so about 2.3% of all Americans were in Boy Scouts. Now it's 1M scouts in a population of 341M, so only 0.3% of Americans are in Boy Scouts.
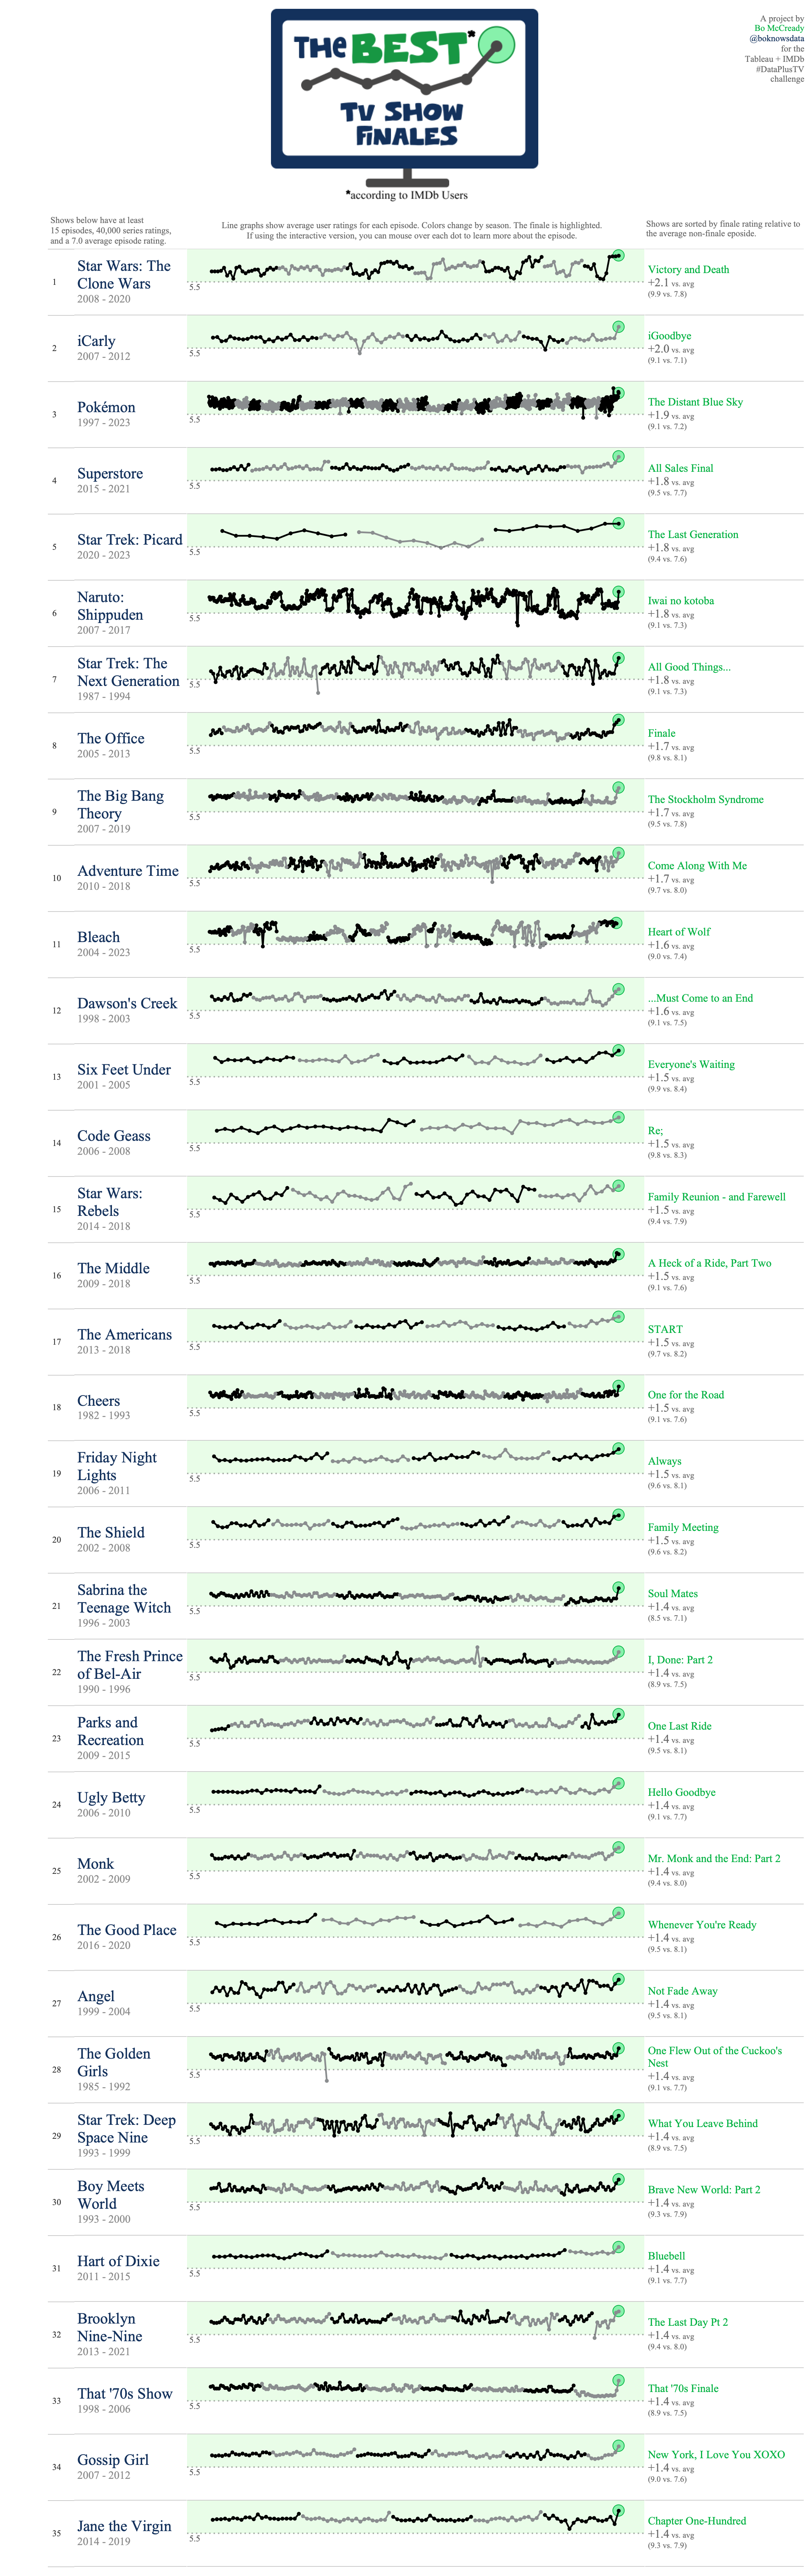
Interactive version: https://public.tableau.com/app/profile/bo.mccready8742/viz/TheBestTVShowFinalesDataPlusTV/BestTVShowFinales
Source: https://reddit.com/comments/1f42jj3
Feel free to have a look at [email protected] for a shows oriented community
cross-posted from: https://feddit.org/post/2312726
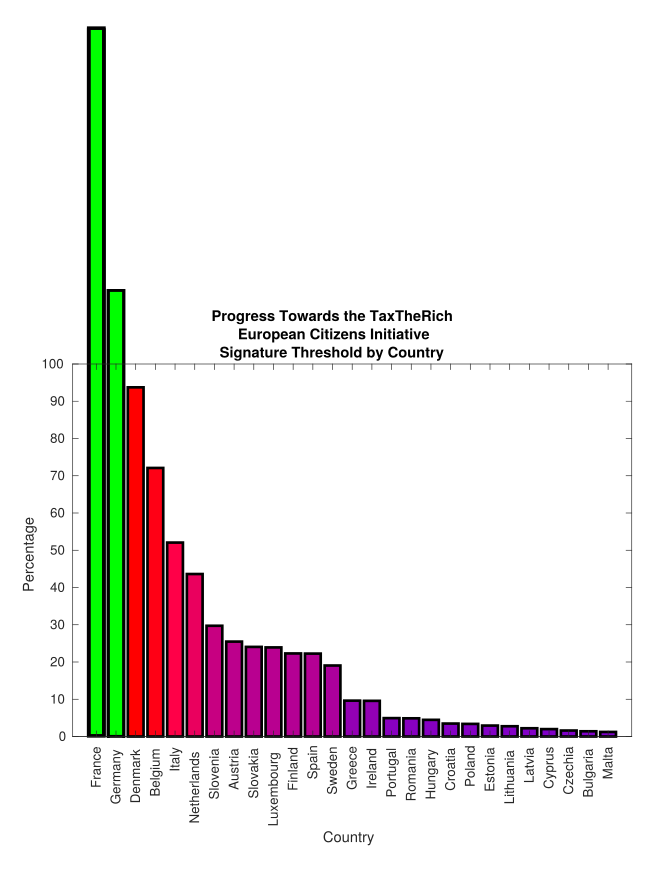
We need taxes for all - also the super-rich.
"Tax the rich" is an official EU petition. The EU Parliament has to deal with it when successful.
7 EU countries must reach the quorum Check yours in the chart and share!
The petition calls for the introduction of a wealth tax on very large fortunes. Sign now