No problems with nodebb, just an observation of so many people wasting their lives trying to hack others. Some having the potential to be highly skilled and well paid folks but instead spend their time trying to hurt others.
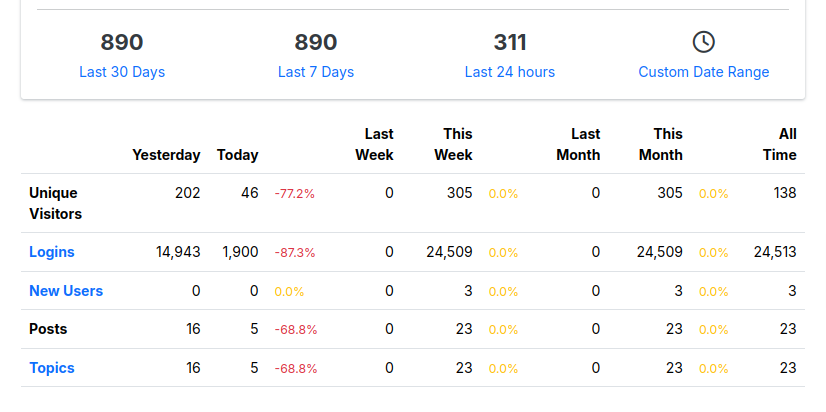
I put a site online just to test a few things. It's not advertised or mentioned anywhere yet but look at the stats. Lots of hits from bots, most presumably looking for Wordpress sites. I just thought it was interesting and wanted to share.
Yup, it is internal.
I found this for anyone that comes across this. https://community.nodebb.org/topic/12493/nodebb-plugin-prometheus-prometheus-monitoring-for-nodebb