this post was submitted on 27 Jan 2024
518 points (85.1% liked)
Data Is Beautiful
7228 readers
3 users here now
A place to share and discuss data visualizations. #dataviz
founded 4 years ago
MODERATORS
you are viewing a single comment's thread
view the rest of the comments
view the rest of the comments
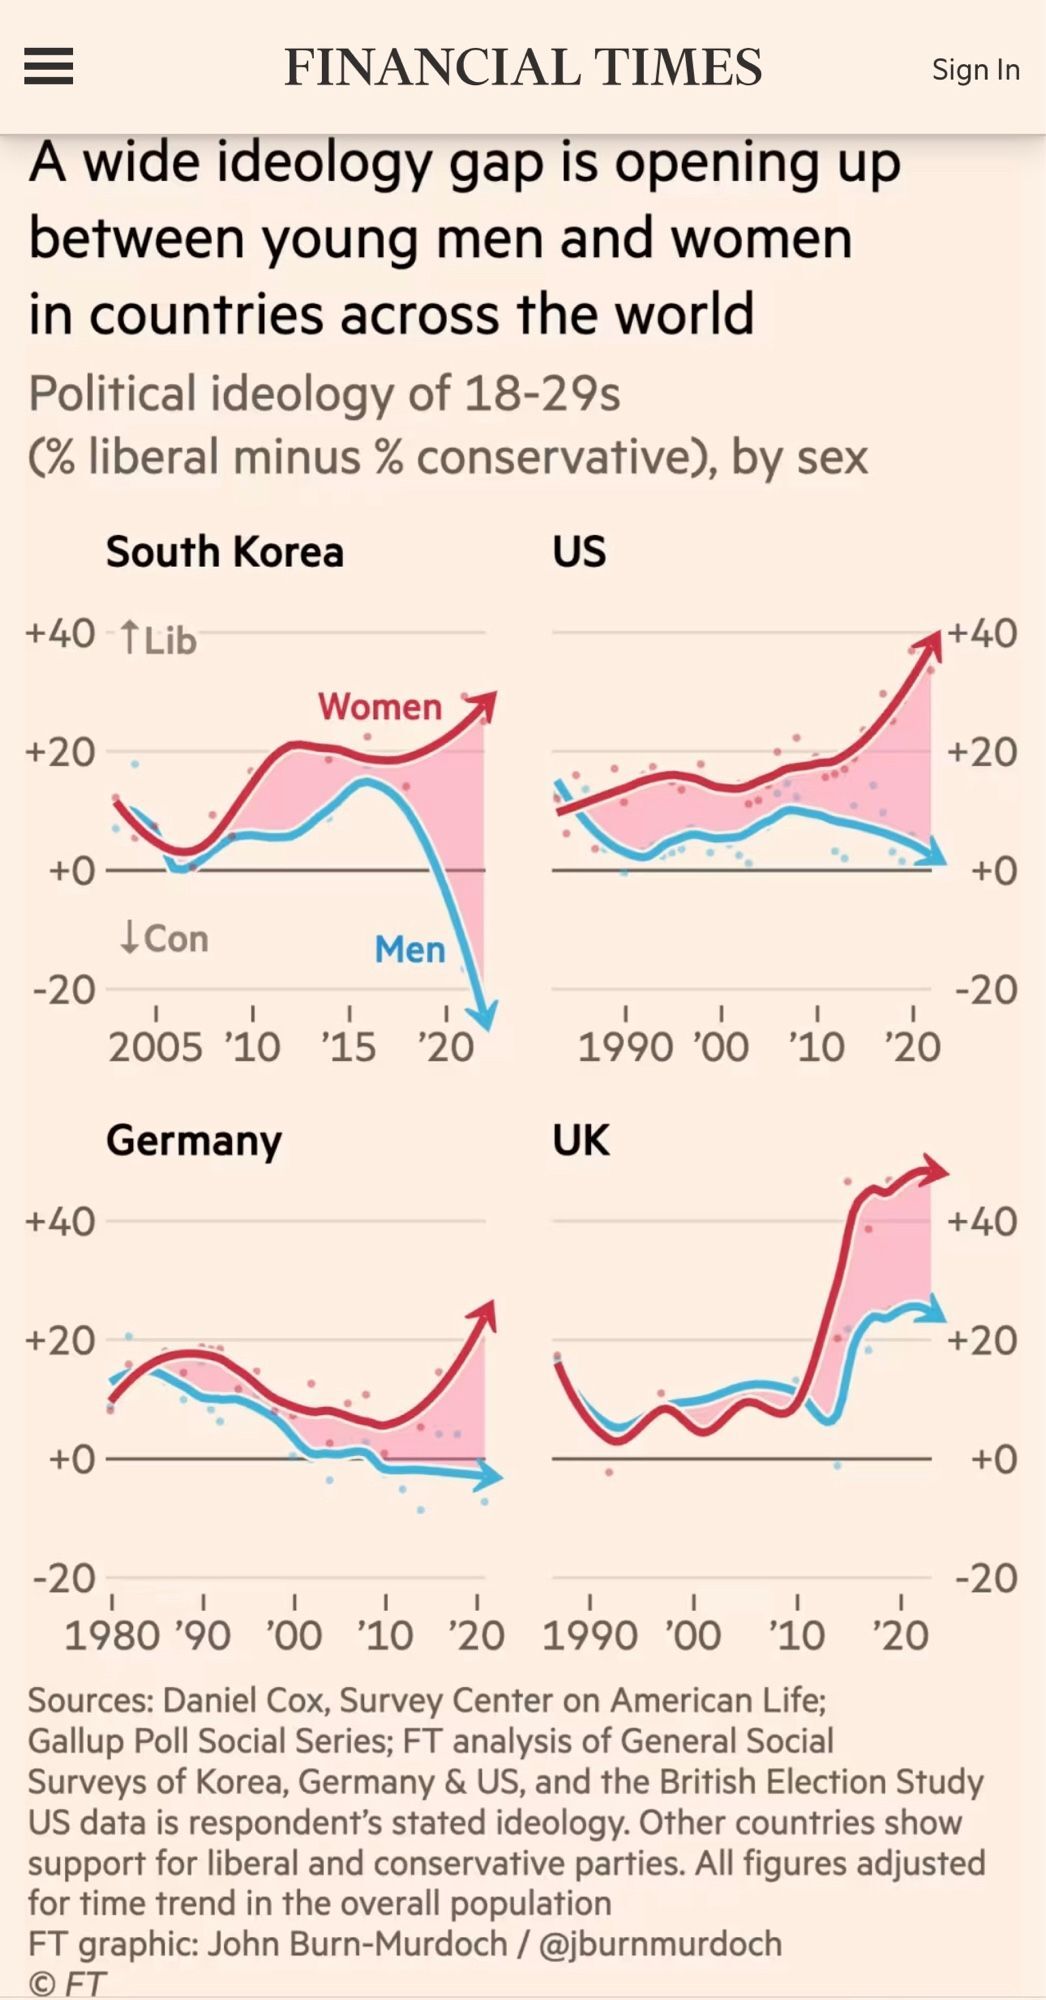
I really don't like that the graphs aren't across the same period of time.
I didn't notice until you pointed it out. Because why wouldn't they be??
Because there's lies, damned lies, and statistics...
Presumably they are starting wherever the trend "started", although I'd like to see what it was doing before that to see if this is an unusual trend or not
Because gaps in data are a thing? I dunno, it doesn't really seem to change the story or the outcome. Your concerns seem overblown.
Then attention should be drawn to the fact that the timelines are different. The data is presented in a misleading way and we should hold ourselves to a higher standard.
Axes should remain the same with the lines missing at parts where there are missing data. This makes it clear
That's funny, because that's exactly what they did.
Omg I didn't even notice that. It's like the more you look at this the worse it gets.
I'm guessing the data sets they used were collected at different start times and they didn't want to truncate it
yes thats probably why but then maybe they should've left a white space instead