this post was submitted on 14 Aug 2023
38 points (95.2% liked)

PC Master Race

14226 readers
1 users here now

A community for PC Master Race.

Rules:

  1. No bigotry: Including racism, sexism, homophobia, transphobia, or xenophobia. Code of Conduct.
  2. Be respectful. Everyone should feel welcome here.
  3. No NSFW content.
  4. No Ads / Spamming.
  5. Be thoughtful and helpful: even with ‘stupid’ questions. The world won’t be made better or worse by snarky comments schooling naive newcomers on Lemmy.

Notes:

founded 1 year ago
MODERATORS
 

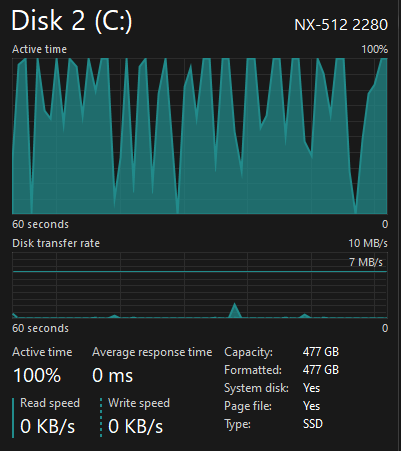
As you can see on the screenshot. Task Manager is saying that the Active Time of my NVM.e system drive has a lot of peaks that start to happen after a few minutes of using the PC and they won't go away unless I restart. I have tried so many things that I gave up and formatted the whole drive and reinstalled Windows from scratch. I have also tried the chkdsk command and this problem won't go away. This started to happen just a few days ago, out of the blue. The whole system freezes at every peak you see on the screenshot and the main tab of Task Manager reports the Disk Usage as being ~1%, so there is no process using the disk. Resource Monitor is also reporting the same thing.

Edit: I have narrowed down the problem to a insanely high Response Time on Resource Monitor (up to 2000ms). It is usually the “System” process that is having this high Response Time. Any way of fixing or at least knowing the root cause of this?

you are viewing a single comment's thread
view the rest of the comments
[–] [email protected] 8 points 1 year ago

Microsoft has some tools to identify active io

https://learn.microsoft.com/en-us/sysinternals/

One of the tools in this suite should offer the insight you're looking for