this post was submitted on 16 Jun 2024
266 points (92.9% liked)
Data Is Beautiful
7909 readers
1 users here now
A place to share and discuss data visualizations. #dataviz
founded 4 years ago
MODERATORS
you are viewing a single comment's thread
view the rest of the comments
view the rest of the comments

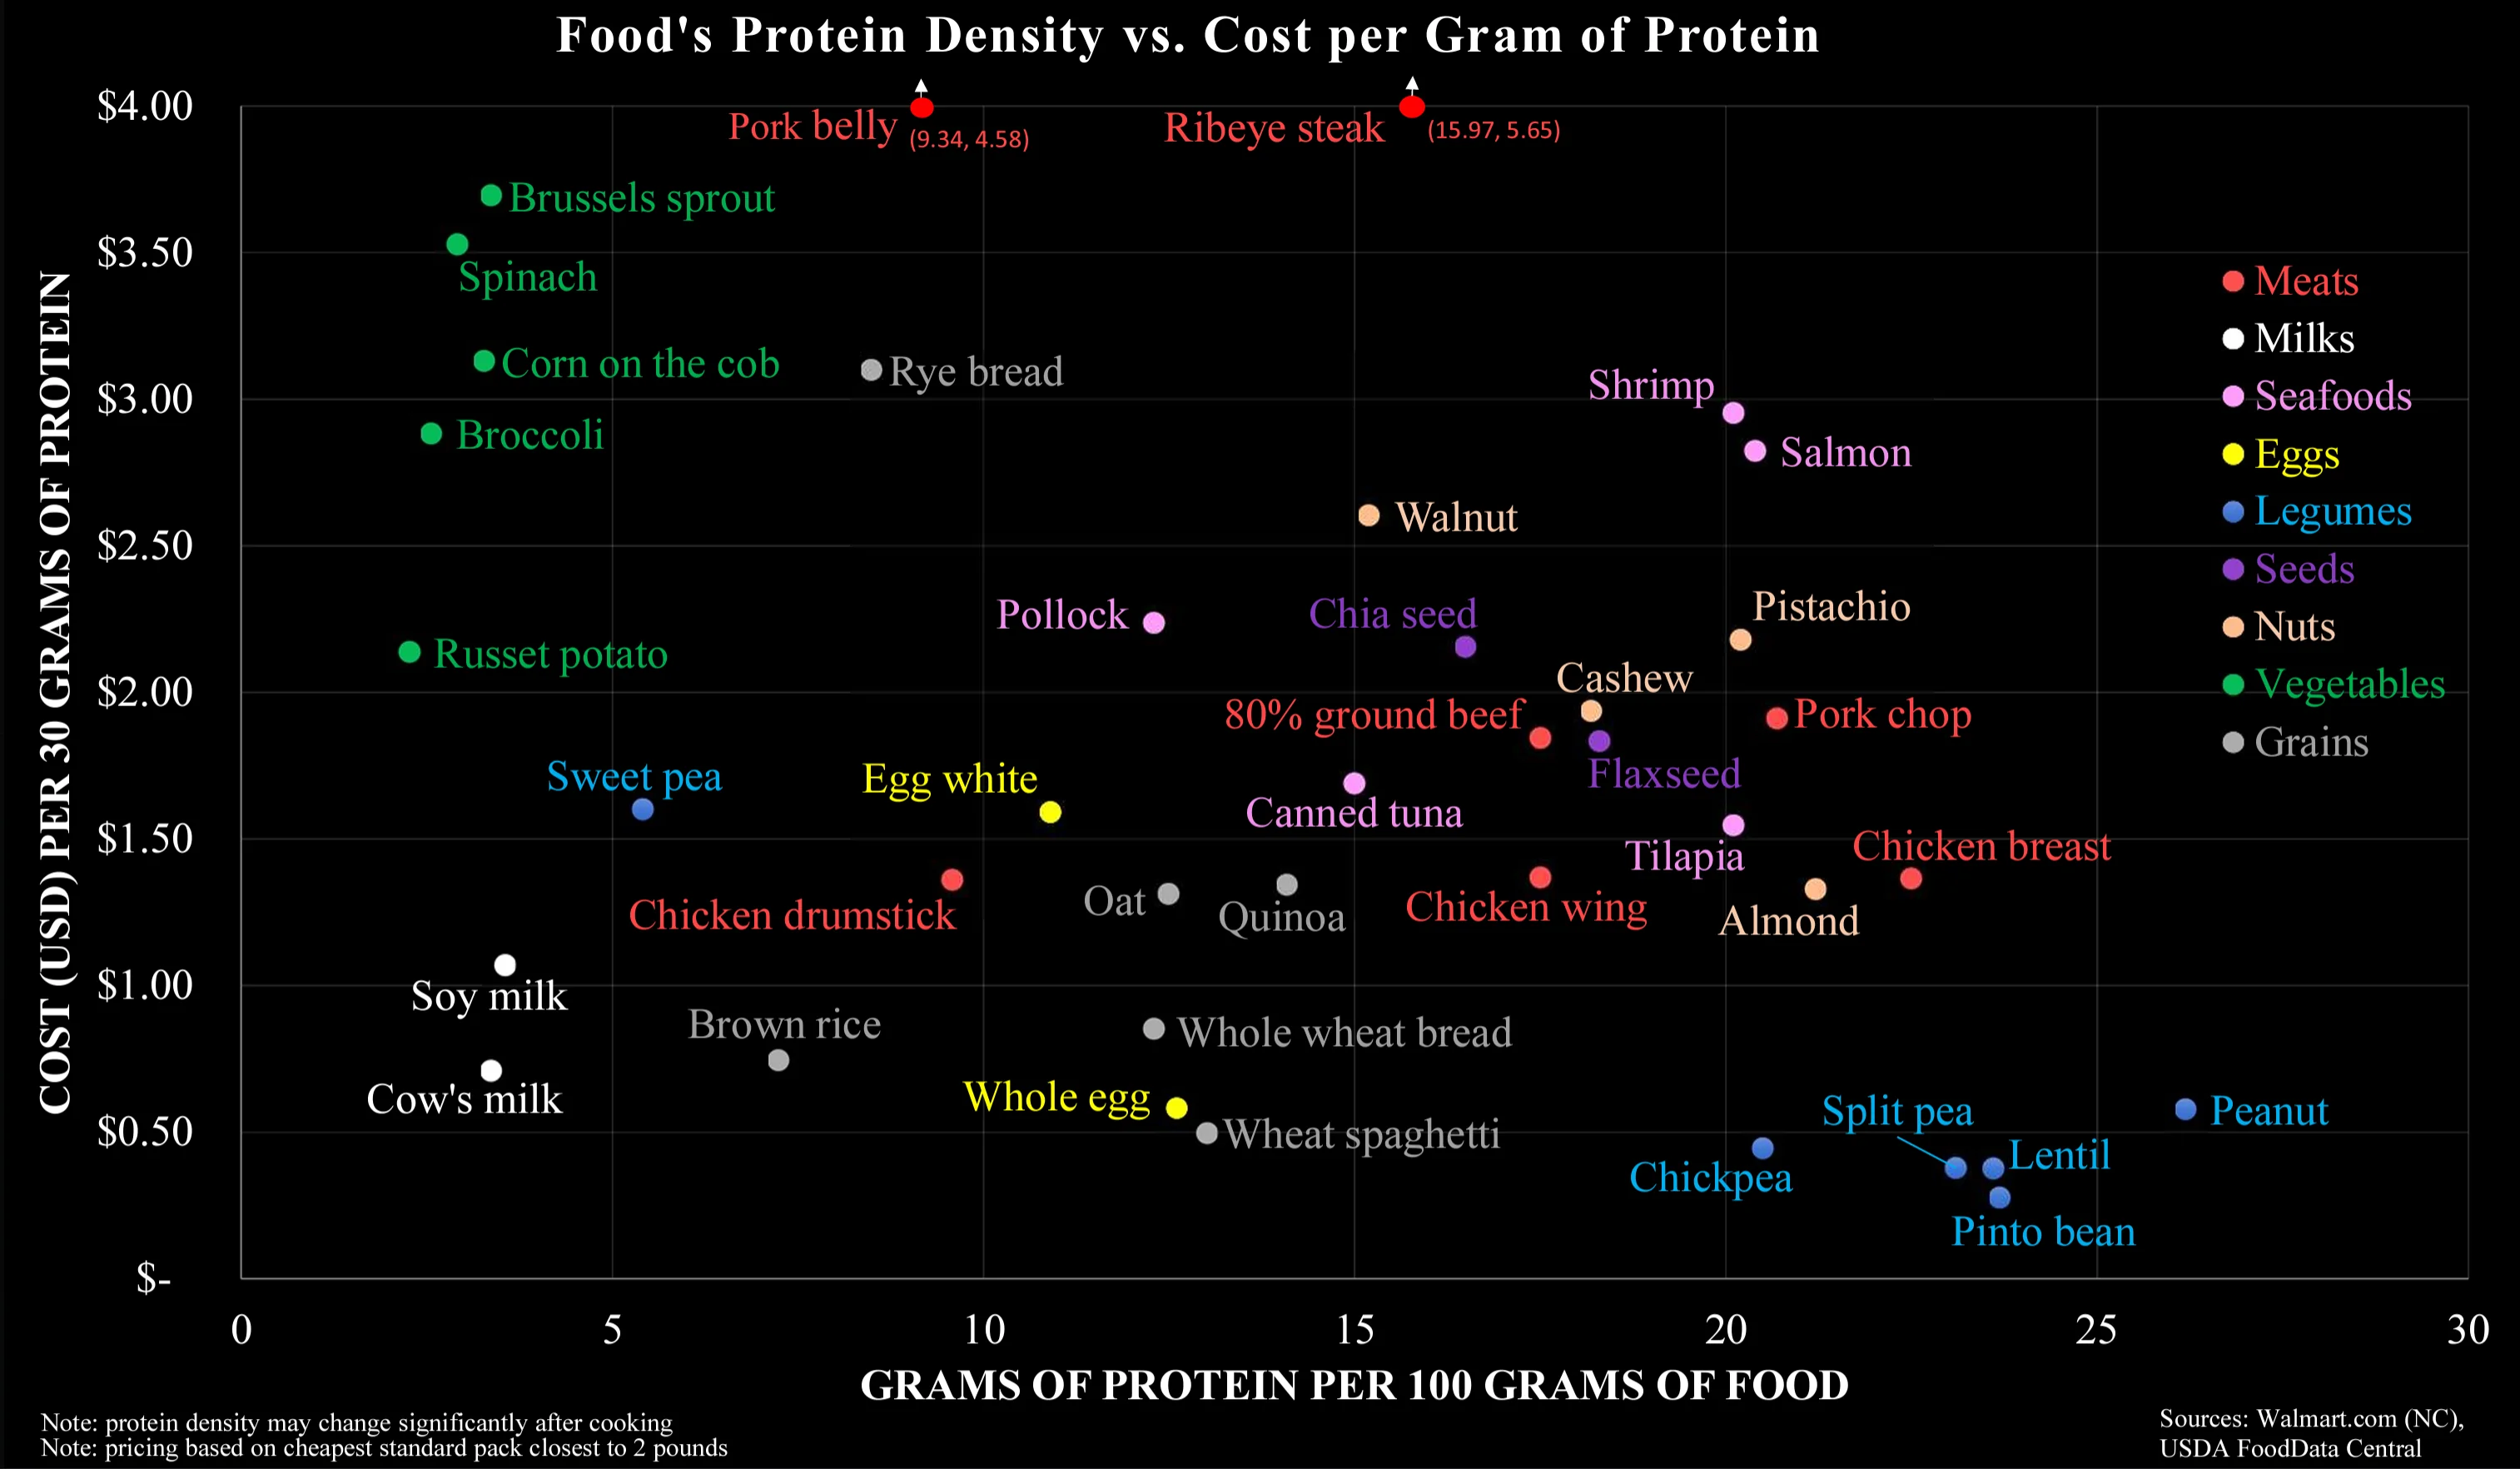
Thank you for saying this. The PDCAAS shows the digestible properties of different protein sources. It would be a good multiplicative factor for the X-Axis to make the sources comparable, since Cow's Milk, Chicken, Egg, Whey, Casein, Tuna and Soy Protein (Isolate) have a score of 1 while Lentils, Tofu, Rice and Wheat have roughly 0,5.
That means you need to eat (and buy and cook) twice the amount of the latter to gain roughly the amount of actionable protein of the former.