this post was submitted on 19 Oct 2024
0 points (50.0% liked)
Political Memes
5359 readers
94 users here now
Welcome to politcal memes!
These are our rules:
Be civil
Jokes are okay, but don’t intentionally harass or disturb any member of our community. Sexism, racism and bigotry are not allowed. Good faith argumentation only. No posts discouraging people to vote or shaming people for voting.
No misinformation
Don’t post any intentional misinformation. When asked by mods, provide sources for any claims you make.
Posts should be memes
Random pictures do not qualify as memes. Relevance to politics is required.
No bots, spam or self-promotion
Follow instance rules, ask for your bot to be allowed on this community.
founded 1 year ago
MODERATORS
you are viewing a single comment's thread
view the rest of the comments
view the rest of the comments
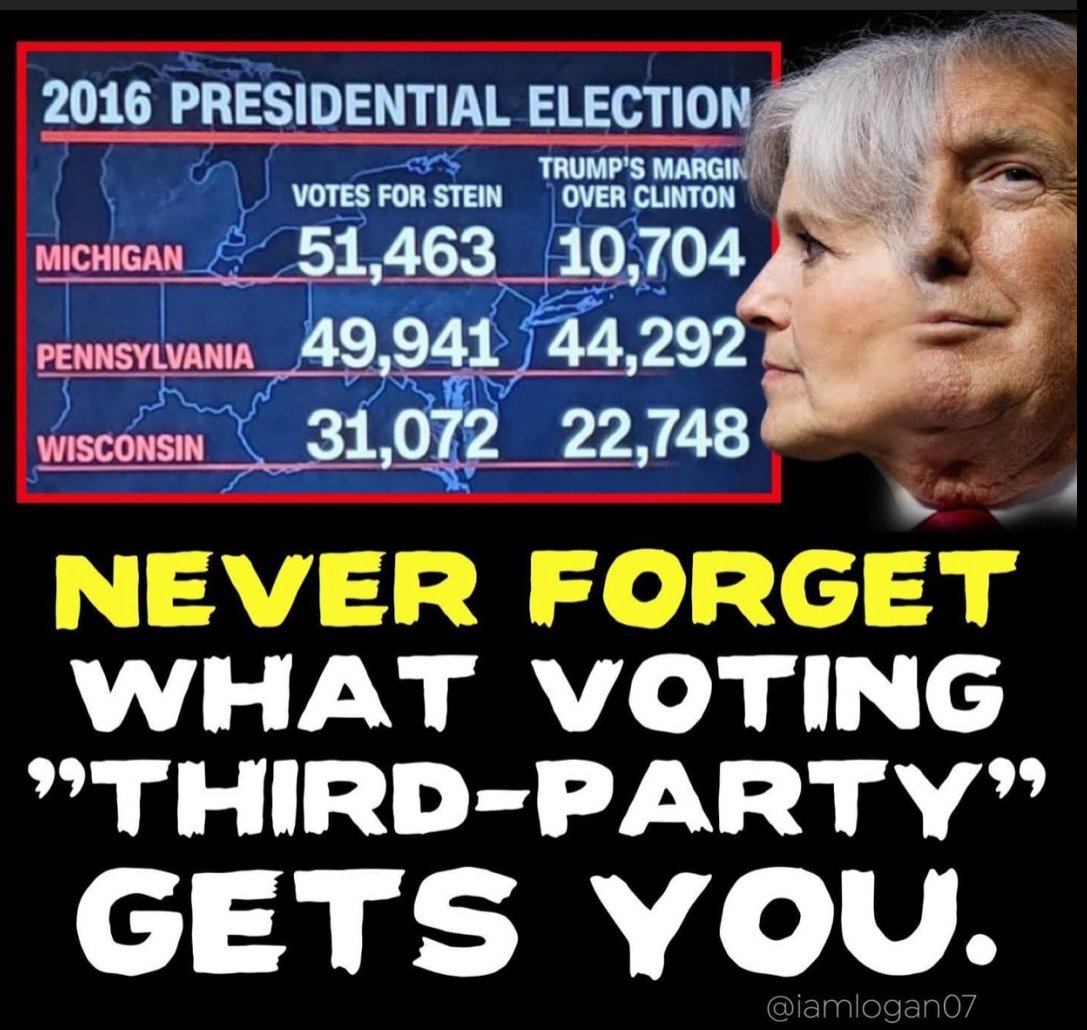
Cool lie, dude! These numbers are all at least slightly off. In Michigan, Trump won by 11,612, and Stein got 50,700. In Wisconsin, Trump won by 27,257, and Stein got 30,980. Most importantly, in Pennsylvania, Trump won by 68,735, while Stein only got 48,912, meaning even if every Stein voter in this graphic went to Clinton, Clinton still would have lost not only Pennsylvania, but also the Electoral College, with the final total being 280 to 258.
Given that this is at least the second time this user has been caught spreading disinformation through fake infographics, we should all be more skeptical of their posts. They clearly either don't know or don't care about the reality.
See how that says "99.8% reporting"? If you look at the NYT, it shows the results after counting 100% of the votes, and it matches what's in the picture.
Fair enough, you are correct. Still bullshit to think that all of those voter would automatically go to clinton, but I will delete the bad information.